
 Follow
 Professional services firms exist across a wide variety of industries, and while services they provide are very different, architectural firms, law firms, engineering firms, business consultancies, custom programming firms and marketing agencies tend to be managed similarly. All tend to group their activities into “projects” that have three primary components: the services they agree to deliver, the price the customer agrees to pay for those services, and cost of labor and materials. The simplest way to manage such a firm to profitability is to make sure each individual project is run profitably. If all projects are profitable, then the firm should be profitable!
This week, we look three groups of analytics and metrics that many professional service firms use in managing their businesses.
The Data Professional Services Firms Capture
Before diving into the analytics, let’s start with the type of data professional services organizations typically collect and how they gather it.
Larger professional services firms track their operational activities in professional services automation software, which is specifically designed to track projects, labor and scheduling activities, and then provide invoicing and reporting. Other firms may choose to track activities using some combination of their accounting system, project management tools and spreadsheets.
In any event, these firms typically record the following:
- Employees and their costs.
- Projects that have been booked and are anticipated in the future.
- Project budgets, including anticipated tasks and labor requirements.
- Project task lists and assignments.
- Employee time-sheets and hours worked by project and task.
Existing Project Progress: Remaining Revenue vs. Remaining Cost

Project Status List with Remaining Revenue and Labor Cost
As a professional services firm manager, my starting point for all my management activities is pretty simple: a list of all of my projects, the original budget (cost and revenue), the amount we’ve billed the clients so far and the remaining cost. If the amount of work we think is left on the project is greater than it should be for the amount that we have left to bill the client, that project is probably in trouble and I need to dig a little deeper to figure out why.
Of course, it can get a lot more complicated when you consider non-labor costs involved in your projects, but in general, all project status lists include the same things: budget, progress to date, and some metric that tells you if that project is healthy.
Here are a few of the more-detailed metrics I like to see on these kinds of reports – and the detailed reports that back them up:
- Cost remaining vs. revenue remaining.
- Budgeted labor, labor cost-to-date and estimated labor remaining.
- Budgeted non-labor cost, non-labor cost-to-date and estimated non-labor cost remaining.
- Budgeted revenue, amount billed and billable revenue remaining.
- Budged vs. actual margin.
Project Pipeline – Anticipated Revenue and Cost

Project Pipeline with Anticipated Labor and Revenue
My next priority is to make sure that enough projects are flowing into my organization to keep our workforce working and to cover our costs. To do so, I typically like to see a list of the projects that my sales team is pursuing, their anticipated labor and revenue requirements, and the probability that we’ll win the work. This helps me get a sense of where my organization is headed, whether I will meet my goals for the year and — most importantly — whether I will need to add labor.
Here’s what I look to include in these types of reports:
- Booking status of projects that are booked, in negotiation or anticipated (with probability of closing).
- Estimated revenue.
- Estimated labor and non-labor costs.
- Anticipated margins.
- Anticipated start and end dates.
Labor Utilization: Anticipated Demand vs. Available Labor
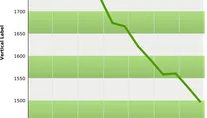
Anticipated Labor Supply and Demand for the Year
Finally, for most professional services organizations, labor represents the greatest source of revenue and cost. There are an awful lot of ways to think about labor requirements, but I tend to prefer a very simple view of the world: for each type of labor that I employ, how many hours of work do I have available over the next year, how many will I need, and how much of my employees’ time is spent working on billable activities?
This is where I usually worry about utilization rate, or the percentage of my employees’ time that is spent on activities that directly contribute to work that is billable to my clients.
This is what I look to include in these types of reports:
- Labor type: management, programmer, business analyst, statistician, etc.
- Anticipated need.
- Hours of labor remaining.
- Observed utilization rate to date.
DataClear is a Baton Rouge-based data analytics consulting firm. Contact Us for a free 30-minute consultation and discover how your company can profit from data-driven decision making using tools that won’t break your budget.